Project Overview
An events company was running Meta Ads campaigns across many shows and venues but struggled to connect ad spend to actual ticket revenue, especially when tickets were priced in different currencies. The dashboard ingests the three standard Meta exports (Days, Days + Placement + Device, Days + Time) and pairs them with live ticket sales pulled from a public Google Sheet.
A regex-based rules file maps every ad row to its show and funnel stage. Non-USD revenue is converted with live exchange rates (open.er-api.com, with offline fallback), and ticket KPIs reflect the latest snapshot per show, so capacity, tickets sold, revenue, and occupancy always stay current.
For the first time the team could see, per show, how Meta spend translated into tickets sold and USD revenue, with funnel decay and pacing alerts surfaced directly in the dashboard.
Key Metrics
Technical Approach
Data Ingestion
- Multi-CSV Meta Ads export parser (Days, Days + Placement + Device, Days + Time), auto-detecting file type by column signature
- Public Google Sheets connector that stops at the endRow marker to avoid historical noise
- Regex rules file (campaign_mapping_fixed.csv) that classifies every ad by show, funnel stage, and legacy tags
- Live FX from open.er-api.com with a 6-hour refresh and static-rate fallback when the API is unavailable
Analytics Pipeline
- Revenue normalization to USD for cross-show comparison
- Snapshot-aware ticket metrics (latest report per show drives capacity, tickets, revenue, and occupancy)
- Funnel decay across F1 / F2 / AddToCart / Purchase stages
- Pacing alerts and per-show ROI surfaced next to raw downloadable datasets
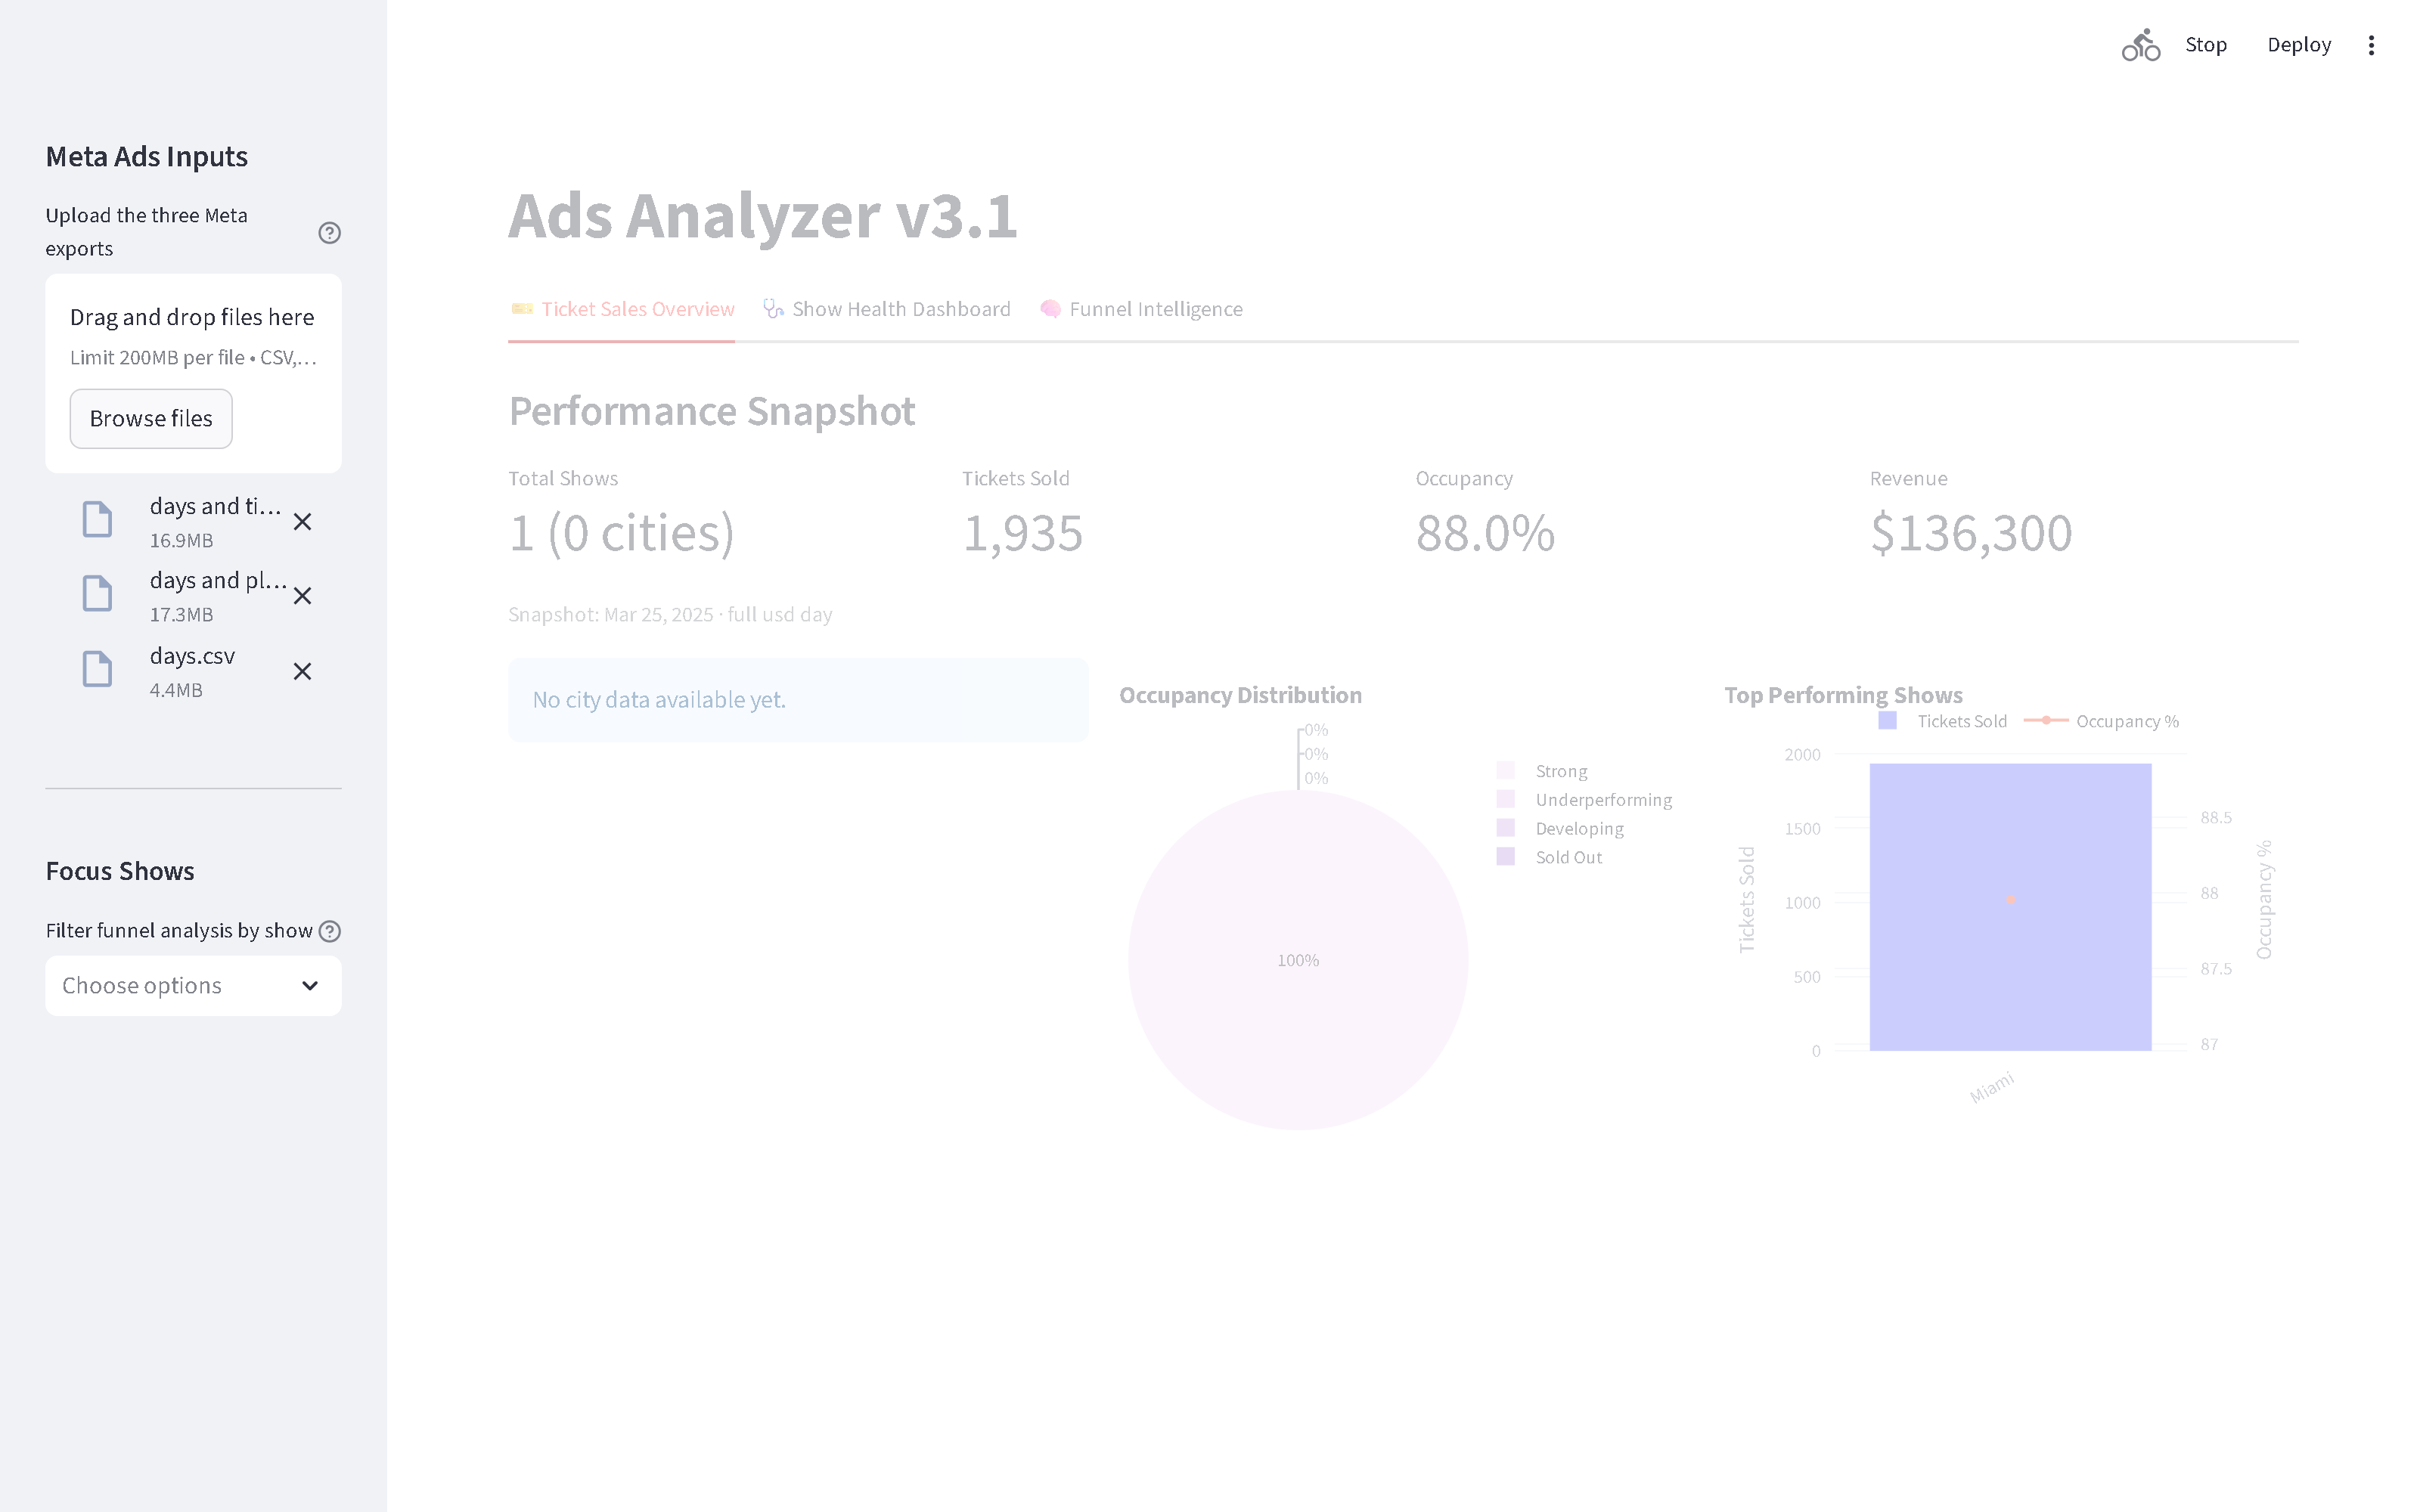
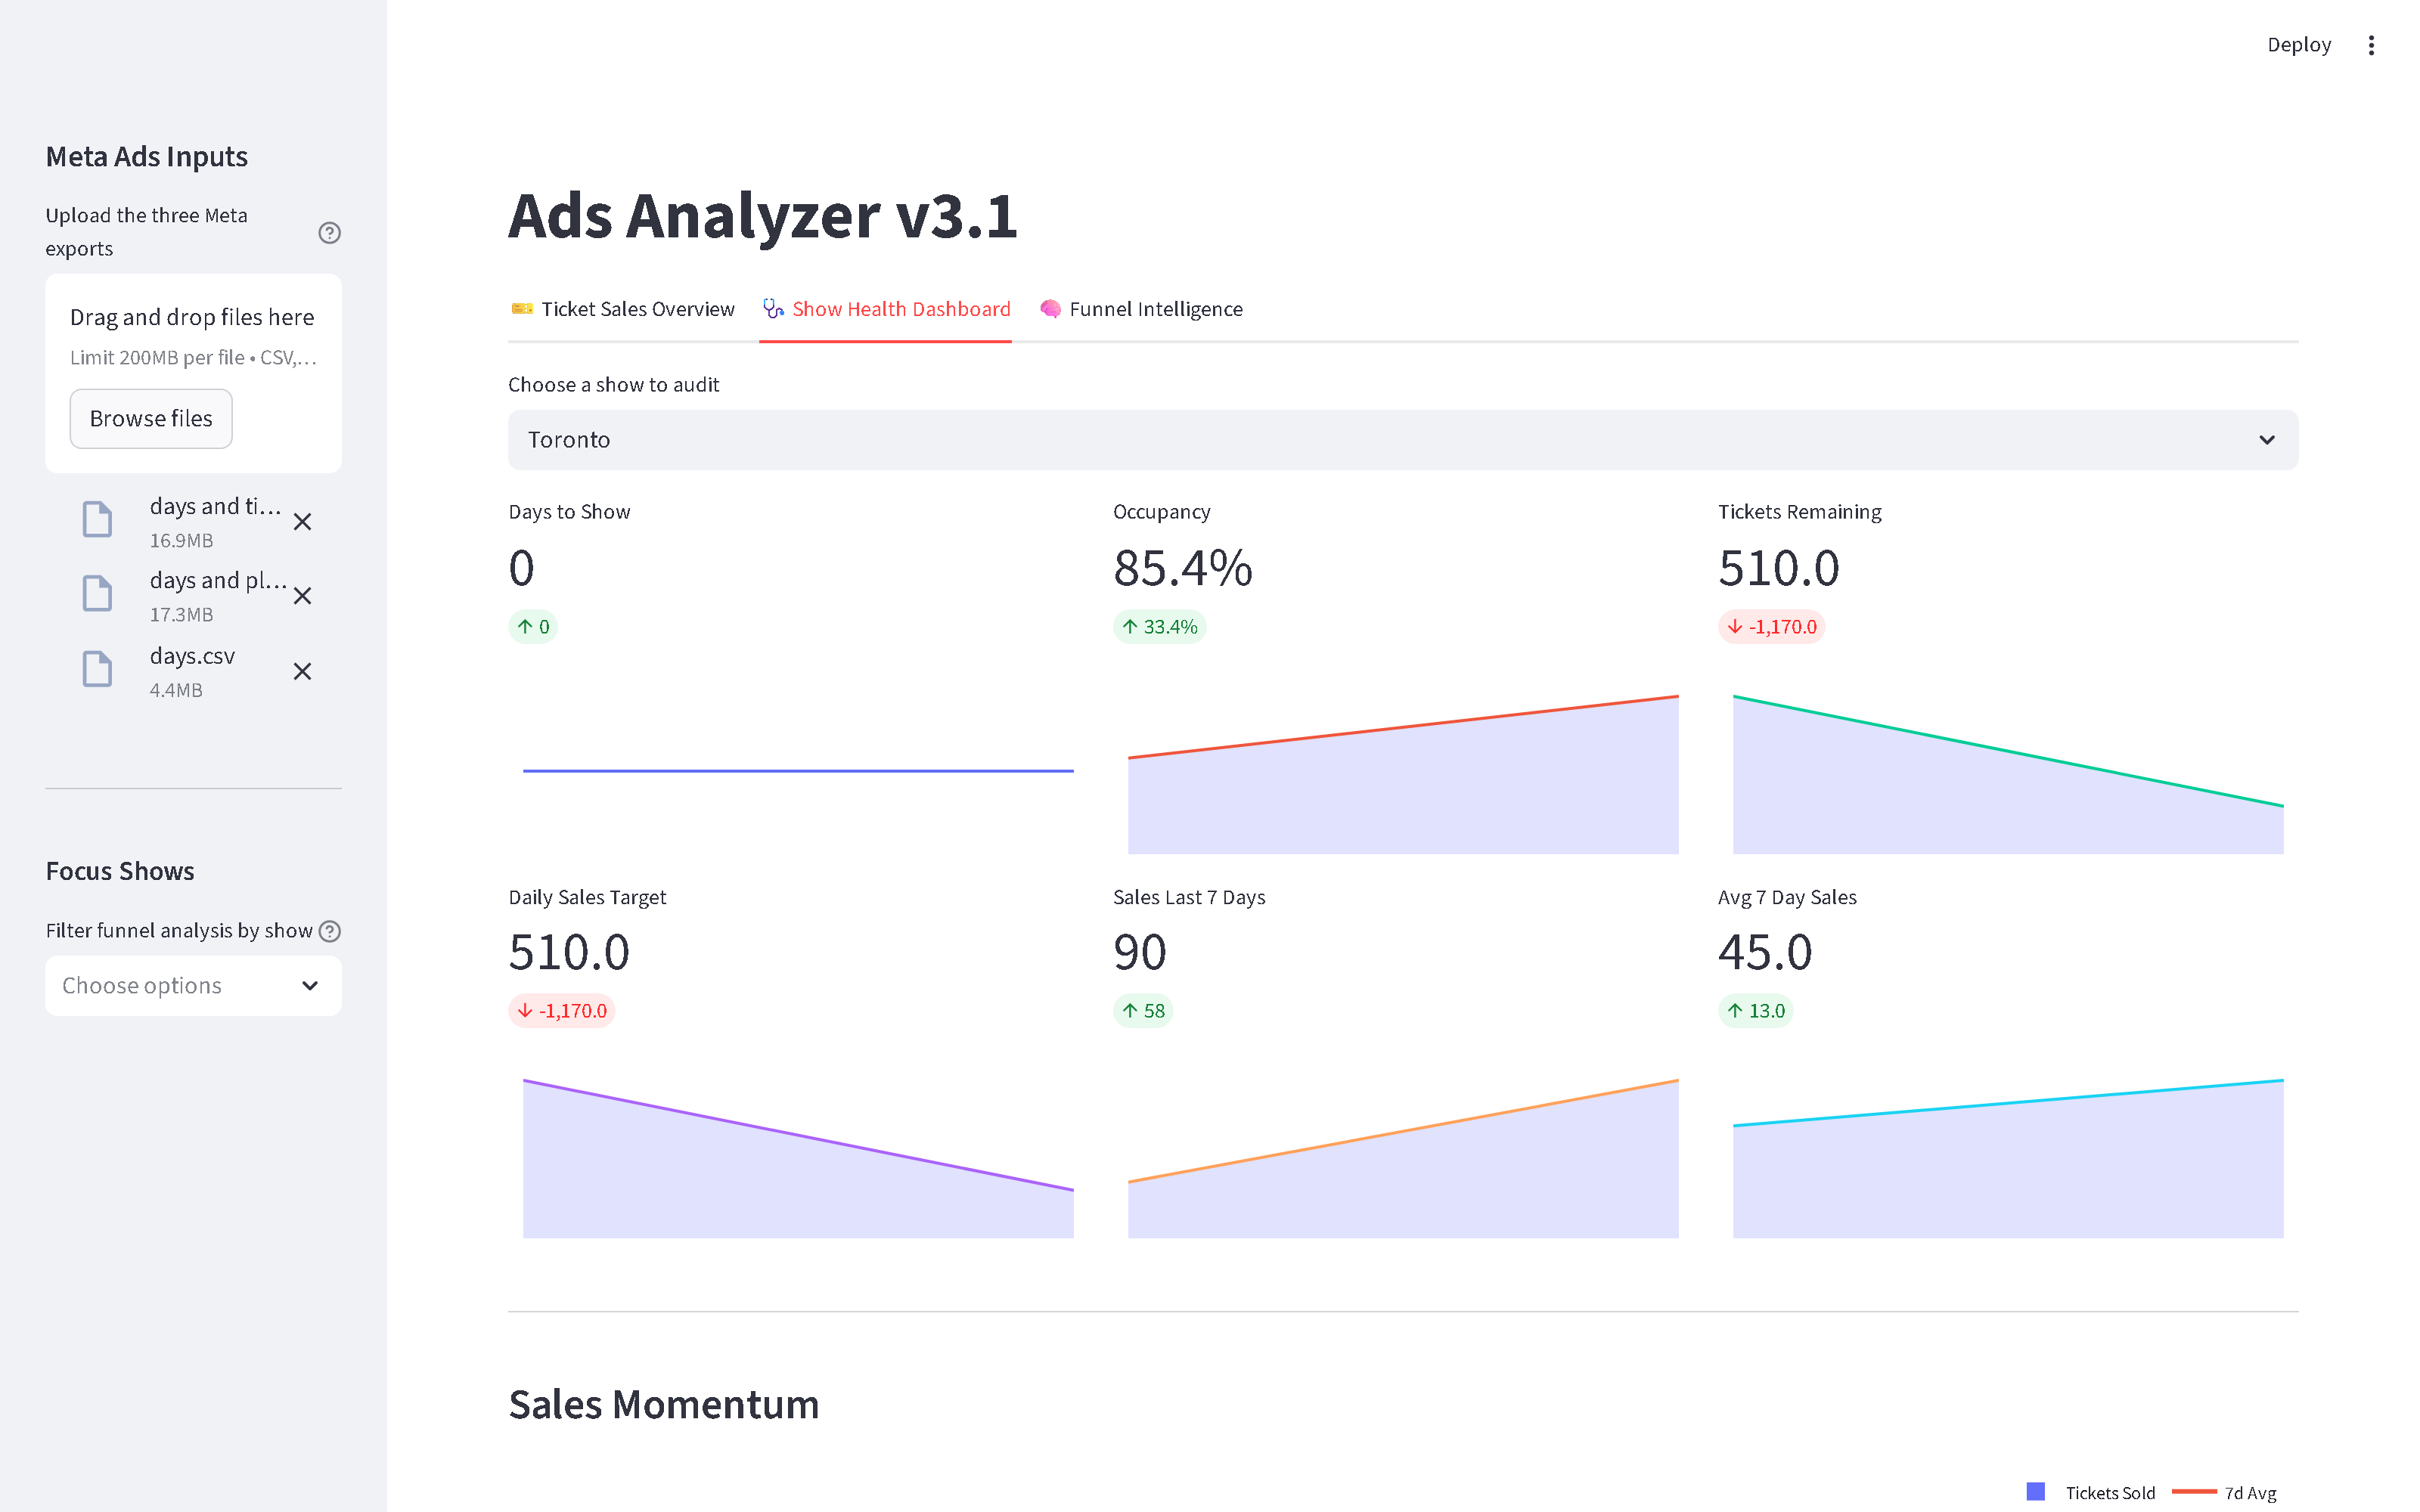
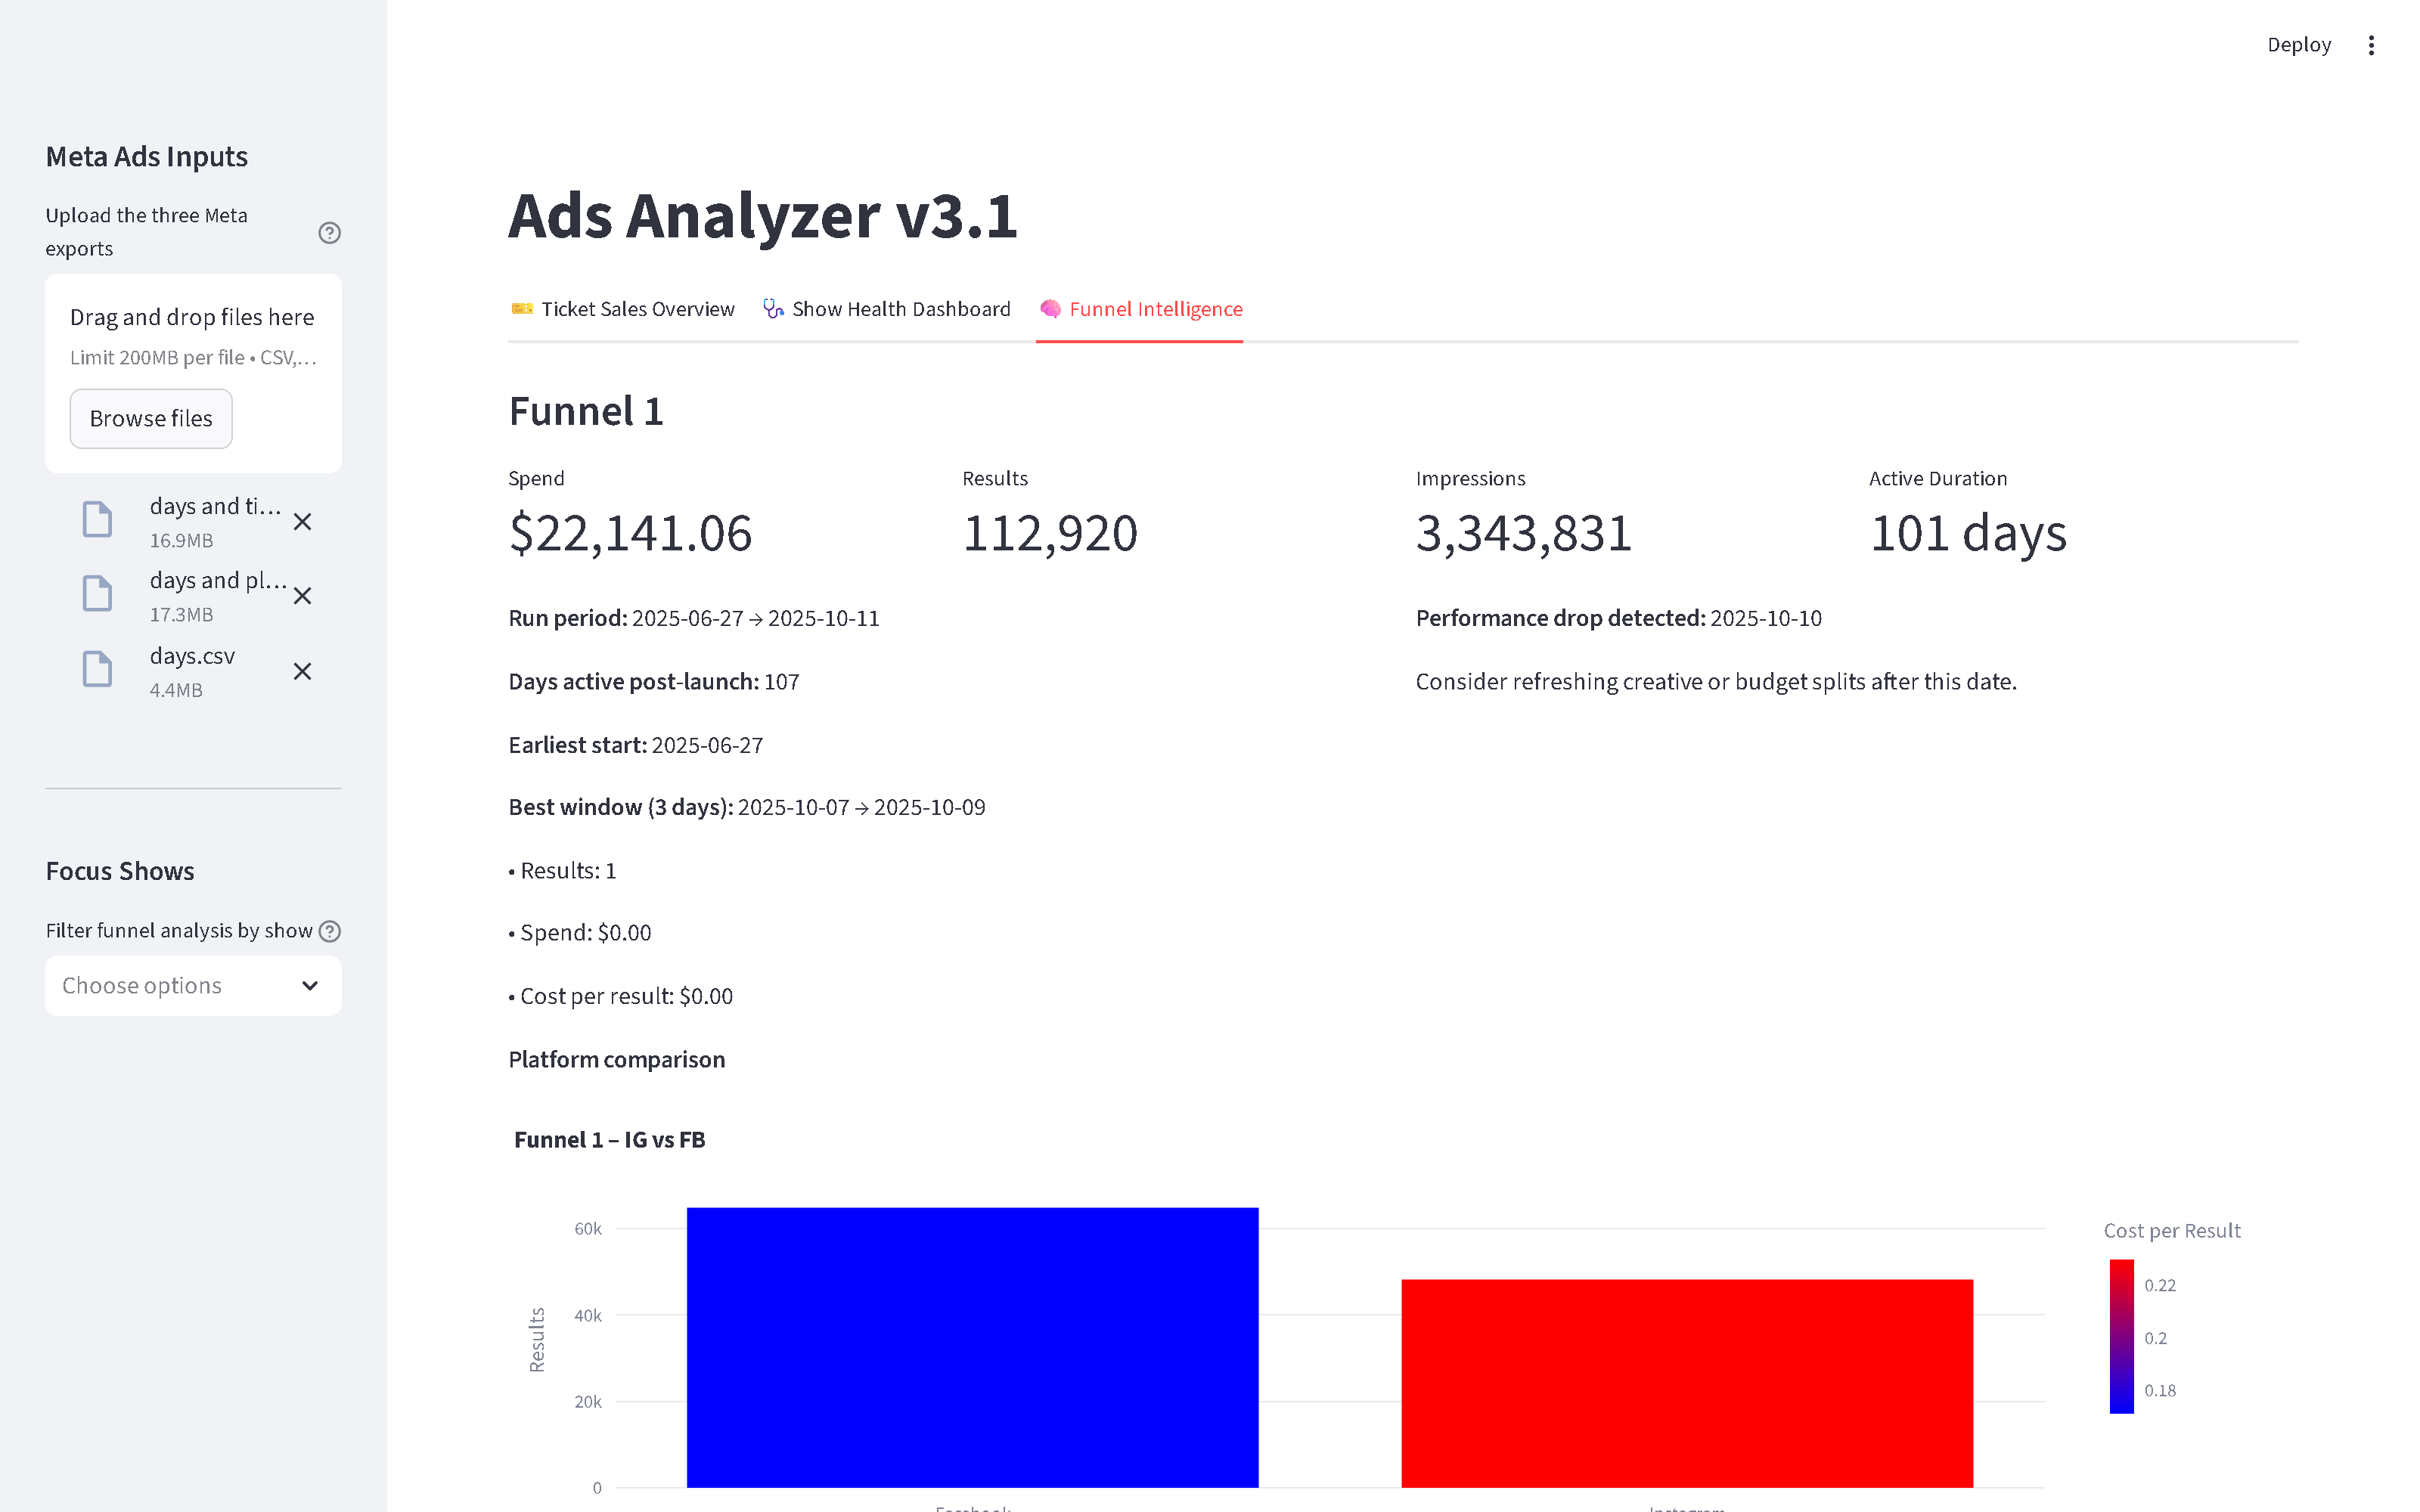
Dashboard Screenshots
Running locally with the three Meta exports uploaded and a representative ticket-sales snapshot in place of the revoked live Google Sheet.
Evolution: from regex MVP to production stack
v1 — ads-analyzer
First iteration focused only on Meta Ads. A single Streamlit page ingested up to three CSV types and used a regex rules file to classify every ad by show and funnel stage. Designed for quick deployment on Streamlit Community Cloud.
v2 → v3 — ads_analyzer
Integrated live ticket sales from a public Google Sheet, added currency-aware revenue handling with live FX, and reworked ticket metrics to be snapshot-aware so every KPI reflects the latest report per show.
optimization_v4
Refactored the data mapper, centralized environment-aware caching and logging in deployment_config.py, and produced deployment checklists for Ubuntu VPS with systemd and for Fly.io, ready for a small-footprint production run.
Technologies Used
Deliverables
- Integrated Streamlit dashboard covering funnel decay, pacing alerts, and FX-aware revenue per show
- Reusable public Google Sheets connector module with health-check endpoint
- Human-editable regex rules file that drives show and funnel classification
- Deployment guides for Ubuntu VPS with systemd and for Fly.io, plus a deployment checklist